NEW TPACS Model output, perfect for understanding Park 'N' Ride and other multi-modal trip features
30 Jul 2024
Morgan Weston
NEW TPACS Model output is perfect for understanding Park ‘n’ ride and other multi-modal trip features
New TPACS Model output, NodeTransitionOutput, records the transition volumes that occur on each node. This allows us to gain valuable insight into where and how people transition between modes on a trip, as well as detail on how and where people start and end their trip. This output would be great for addressing some of the following questions:
- Where is the optimal spot for a Park ‘n’ ride facility? and how big should it be?
- Where are PT trips starting and ending?
- Where do people park and then walk to their final destination?
- Where are cycle trips starting and ending?
- Scenario testing how could we improve PT and active transport use through infrastructure or policy?
What is a Transition?
We define a transition as the start or end of a trip, or change in transport mode. The NodeTransitionOutput table reports how many of each type of transition occurs at each node. The figure below gives three examples of where and what type of transitions occur in the TPACS multi-modal model.
What does the output have to say?
The plots below show the total transitions on each node for a number of different transitions types. Each colour represents a different transition type and the size of the node represents the number of transitions occurring at that point. The blue background layer shows the number of trips ending in each SA1 region. From the first figure we can see that the majority of trips ending in active transport are concentrated around the CBD. The pale pink transitions show the nodes where people have transitioned from PT to walk, which highlights the locations of the bigger train stations and busways.
The second plot shows the locations of trips that have ended with parking (purple), or the nodes in which people have parked their car to continue the trip by walking (orange). The figure highlights around the CBD where parking charges are higher people have chosen to park further out and continue their trip in walk to their destination. The darker pink shows the locations where people have transitioned from Driving to PT i.e. Park ‘n’ ride, here you can see this is popular to do for an outer ring around the CBD.
Is there a better way to view these results? A new Hex plot
A limitation of presenting the transition outputs in this node point manner is that the density of the node location is inconsistent. I.e., the CBD might have a lot of nodes within a small area due to its grid like network, whereas the outer suburbs might have longer road links with less connecting nodes. This means some of the volumes on a single node might appear larger and therefore more significant than an area with more nodes but each with lower volumes. Similarly presenting totals at the SA1 level as we did above for total end transitions can also be misleading due to the variation in SA1 size. For example a smaller SA1 areas might have fewer total trips, even though they have a higher density of trips per square meter.
A better alternative to both these plot styles is the new Hex plot. The Hex plot keeps the area size consistent allowing us to report the total number of transitions (or population) per hex area. The plot below gives some examples of the Hex plot looking at the density of a number of different transition types for the SEQ region.
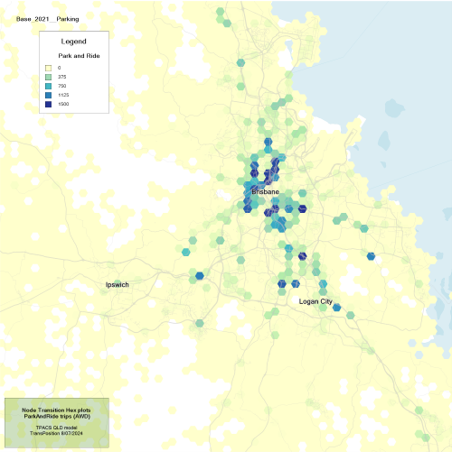
Density of the Park ‘n’ ride transitions
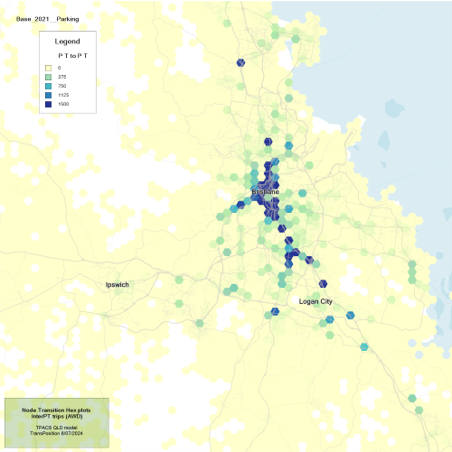
Density of PT Interchanges i.e., how many time people have transitioned from one PT route to another PT route
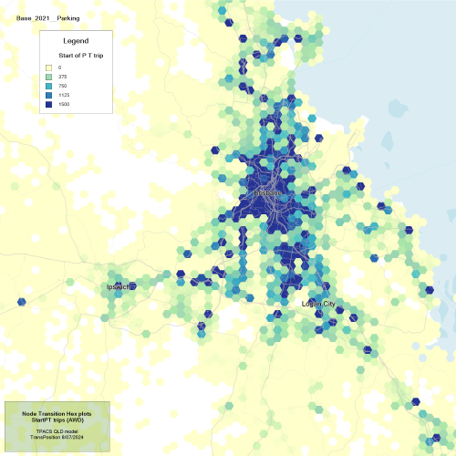
Density plots showing how many PT trips started in each Hex area.